Achievement gaps in educational outcomes are persistent disparities in measures of educational performance among subgroups of U.S. students. Most notable are gaps between groups defined by race or ethnicity, income, and gender. An achievement gap can surface in a variety of outcome measures, including standardized test scores, grades, dropout rates, college enrollment and completion rates. I’m going to focus here on standardized test scores. If we want to make comparisons across U.S. states, and over time, then there are few standardized tests that will fill the bill. If we want to look at gaps in early grades, in contrast to say SAT scores, then there are even fewer options. Maybe only one.
The National Assessment of Educational Progress (NAEP) is mandated by congress as a nationally representative assessment of what U.S. students know and can do in various subjects. It is overseen by the National Center for Education Statistics, a component of the U.S. Department of Education. NAEP scores are intended to provide group-level data on student achievement in a variety of subjects. NAEP reports results for different demographic groups, including gender, socioeconomic status, and race and ethnicity at the state level. It does not provide results for individual students, classrooms, or schools. Core topic areas tested by the NAEP include math, reading, science, and writing. These are assessed every two years; other subjects are evaluated less frequently (arts, civics, economics, geography, history, etc.). NAEP results are published as The Nation’s Report Card.
NAEP provides results for each state in reading, writing, science, and math for grades 4 and 8. Subgroup scores are also available for most groups in most states.1 This makes it possible to monitor each state’s progress over time, and to compare groups within states, across states, and to the U.S. as a whole. In other words, the NAEP is a reasonable tool for looking at educational achievement gaps through the lens of standardized test scores. That isn’t to say the NAEP is perfect; it isn’t. But, its imperfections have been thoroughly documented elsewhere and I won’t belabor them here.
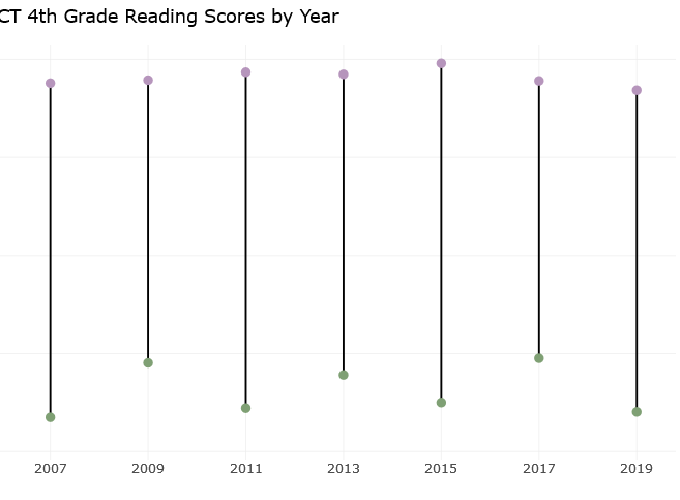
So, with all of that in mind, I’ve built a dashboard with interactive graphs from NAEP 4th grade reading data. It specifically focuses on the achievement gap between African American and White students in Connecticut, and places that in the context of the nation as a whole. You can see it here. Connecticut used to be worst-in-nation on this specific metric, but it improved ever so slightly a few years ago, as reported in the Connecticut Mirror. The R/Rmarkdown code used to build the dashboard is on github, if you want to have a look at it.
This dashboard and its graphs are not an especially refined, nor complete, picture of the data. The graphs could be prettier, and their interactivity more informative. It’s also possible, of course, to add other outcome measures, from the NAEP or elsewhere. But, there is already an abundance of NAEP summaries out there. Why have I bothered to add to it? Why would anyone care? My purpose is to show that with just a little work it’s possible to tailor a view of publicly available data to your own needs, to answer your own specific questions, to support your own agenda. If you’re inspired to try your own hand at it, with NAEP data or another data set, feel free to reach out to me, whether you want to talk shop, or you need a boost to get past some choke point in your process.
I’m looking forward to it.
- Sometimes, a subgroup in a particular state might be too small to reliably estimate state averages for the group. This statistical issue that does not mean that there is no gap, only that the NAEP isn’t the right tool for viewing it, in that instance. [BACK]