A norm-referenced test is one whose score gives an estimate of where a person stands on the trait or skill being tested, relative to some representative group. In education, the skills being tested might range over things like reading comprehension, vocabulary, basic arithmetic, algebra, and more. The representative group may also be referred to as the “normative sample” or “norm group”. For an educational test, the normative sample is nothing more than a group of children, aggregated by age, who have taken the test. The norm group’s scores are used to establish typical performance on that test, for children of their age. For most published norm-referenced tests, the norm group is intended to be a nationally representative sample. But keep in mind that, for each age range in the norm group (say, the kids in a single grade), the sample is often relatively small. It might be anywhere from a few dozen to a few hundred kids.
It’s important to recognize that norm-referenced scores are purely descriptive. Norms are nothing more than the distribution of performance seen in the normative sample of children, which then serves as a standard to give meaning to individual student scores for students outside the norm group. There are a variety of types of norm-referenced scores, each serving a different purpose. In chapter 8 of his 2008 book, Measuring Up, Dan Koretz includes an overview of measurement in education, and strengths and weaknesses of different approaches. It’s a nice discussion pitched at a level that will be approachable to teachers and other professional educators. I recommend the book as a whole, but that chapter will be especially helpful in understanding the nuts and bolts of norm-reference tests.
Determining a student’s norm-referenced score starts with their raw score, which is usually just the number of items correct, but for some tests may be a different function of item responses. The raw score is referenced against the distribution of scores in the normative sample, typically by using a table provided by the test publisher. The table will provide the desired type of norm-referenced score for each raw score.
Raw scores are transformed into norm-referenced test scores in order to put them into context, to give meaning to the scores. For tests that have more than one form and more than one level, norm-referenced scores make possible comparisons across different forms and levels of a test, and across different groups of students who take the same test. Performance of the normative sample always serves as the standard for comparison; it is the ruler used to measure all other students’ performance.
The different kinds of norm-referenced scores can be thought of as different scales for the measurement of specific traits or abilities. By analogy, you might think of the difference between meters and yards; the metric and imperial systems are different scales for measuring length. In education, we have different test scales because they serve different purposes. Some are simpler to explain to lay people; some are better suited for comparing a student to same-aged peers, and some are better suited to tracking change over time (i.e. progress or development). Not all are well suited to the kind of numerical manipulations necessary for creating summary statistics, like average scores for a group, or for statistical modeling (as in a regression model).
Percentiles & Deciles & Stanines
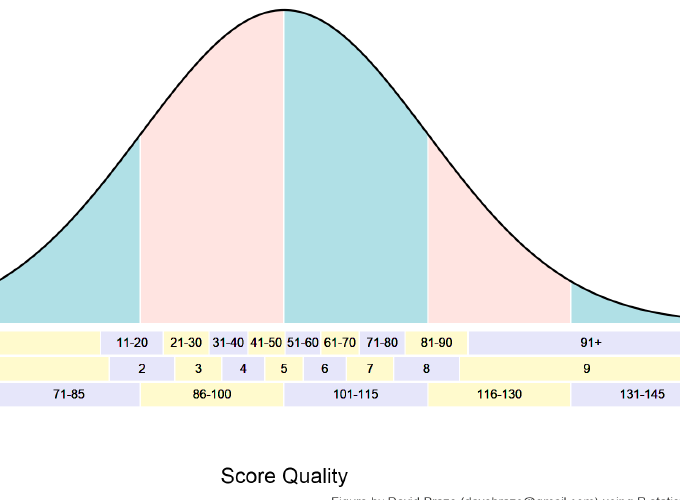
Percentile rank scores signify the percentage of individuals in the normative sample whose scores fell at or below a given score. Percentile ranks divide scores into 100 equal-sized groups, with higher ranks having better performance. Percentile ranks are most commonly age-graded which is to say that they provide a ranking relative to other individuals of similar age. So, a percentile rank of 80 is a score as high or higher than 80% of similarly aged individuals in the normative sample. Deciles are similar to percentile ranks, but in this case the division is into 10 groups rather than 100. The first (lowest) decile includes percentile ranks 1-10; the second decile is percentile ranks 11-20, and so on. Stanines are yet another quantile-based score. For stanines, the division is into equal-sized 9 groups; having an odd number of groups makes it more straightforward to talk about the mid-point on the scale, the fifth stanine. You can think of deciles and stanines as simply percentile ranks lumped into larger bins.
Percentile ranks and stanines are both commonly reported score types for norm-referenced tests. They are also relatively easy to explain. This is important when talking to folks who may not have much familiarity with different types of test scores. Still, they lack the important property of having equal-intervals across their range, and that limits their usefulness for statistical purposes. Just imagine the trouble you would have if an inch in the middle of a yardstick were shorter than an inch at either end!
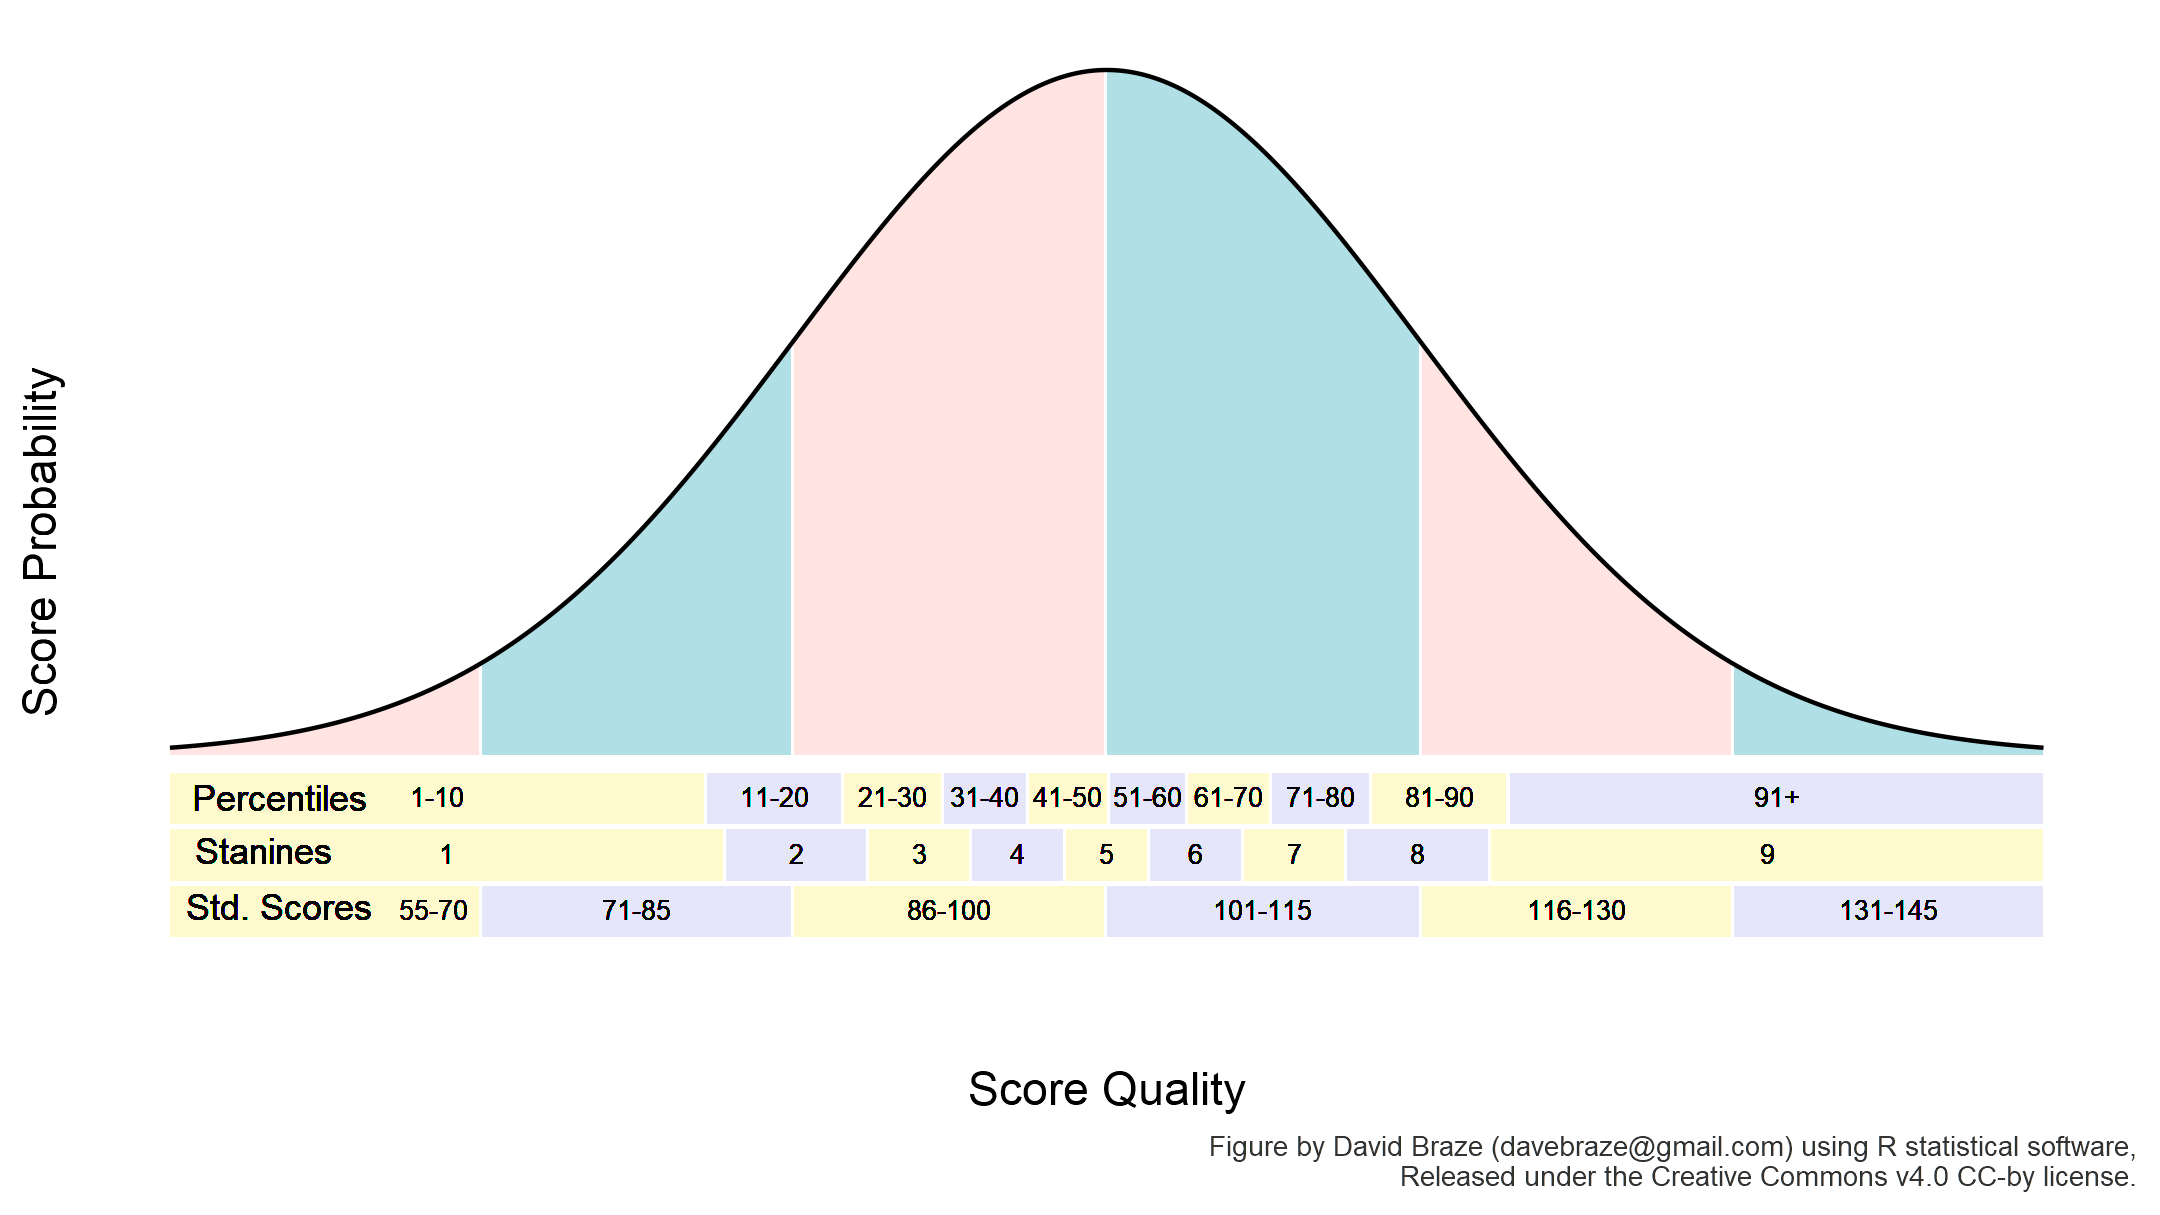
The figure above shows the relationship between the percentiles, deciles, and stanines to each other and to the normal distribution. It also highlights the fact that these are not equal-interval scales. Essentially, a 10 point difference at either end of the percentile scale is larger than a 10 point difference near the middle of the scale. Stanines suffer the same problem. Standard Scores, on the other hand, ARE an equal-interval scale, but they don’t solve every problem.
Standard Scores & Standardized Scores
A standard score is just one type of standardized score, arguably the most common type used in educational testing. A standard score represents student performance along a normal curve (AKA ‘bell curve’, AKA normal distribution), like the one shown above. The mid-point of the curve is the ‘average’ score. Each equal-width blue or pink bin along the curve is one standard deviation wide. For the standard score, the average is set to 100, and the standard deviation to 15.
This makes it easy to see how far a particular student’s score is above or below the norm group’s mean (100) in standard deviation units. A standard score of 105 is one-third of a standard deviation (five fifteenths of an SD) above the average; a standard score of 90 is two-thirds of a standard deviation (ten fifteenths of an SD) below the average. Like percentile ranks, standard scores are typically age-graded. Unlike the percentile rank, the standard score is an equal-interval scale. A 15 point difference is the same, no matter where on the scale you look.
Other types of standardized scores, on different scales, do exist. For example, the T-score is scaled to have a mean of 50 and standard deviation of 10, while the Normal curve equivalent score has a mean of 50 and a standard deviation of 21.06. Scaled scores used by the Gray Oral Reading Test (GORT), and others, is yet another member of the family. These have a mean of 10 and standard deviation of 3. All of these retain the equal-interval quality of standard scores and all are typically age-graded. You’ll sometimes see other choices of mean and standard deviation for standardizing scores in use among educational tests, but all are more-or-less functionally equivalent. The standard score, with a mean of 100 and standard deviation of 15, is probably the most common. Standard scores may be a bit more difficult to explain or to understand than percentile rank scores but, they have better numerical properties in that they do have equal intervals across their range. However, like other age-graded scores, standard scores are better suited to comparison of a student to same-aged peers than to tracking a student’s development over time.
Developmental Scales
So, the different kinds of scales mentioned above are not ideal for tracking progress or development. Why is that? I’ll use an analogy to percentile rank scores to illustrate. Imagine we have a group of 100 students all lined up in single file. Each student’s “score” is their position in line (1, 2, 3, …, 100). Now, let’s march them across the school yard keeping to a straight and orderly line (I didn’t say it was a realistic example). Once across the school yard, we can once again check everyone’s position in line; that’s their new score. Odds are, all or most students will end up with the same “score” they had before. It doesn’t mean no progress has been made. On the contrary, everyone is now on the other side of the school yard, but their relative positions in line haven’t changed. That is the situation with age-graded scores of all types. Age-graded scores make it hard to see progress because each student is ranked relative to their same-aged peers.
This brings us to those kinds of scales that are designed specifically to reveal growth in achievement as students advance through grades: developmental scales. One very common type of developmental scale is the grade-equivalent score. Grade-equivalent scores are typically written with a numerical grade and month, which corresponds to the average score achieved by students from the normative sample at that particular grade and month of their education. A grade-equivalent score of 6.5 is the typical performance of a 6th grader in the fifth month of the school year, on the test in question. So, unlike percentile ranks or standard scores, we expect a student’s grade-equivalent score to increase year-over-year, even if their relative ability (relative to same aged peers) does not change.
Grade-equivalent scores also have the advantage of being quite easy to explain and easy to understand. Unfortunately, like percentile ranks and similar scales (e.g., stanines), grade-equivalent scores cannot be guaranteed to have equal-intervals across their range, although for a different reason. For example, most of learning to read happens in the early grades. In other words, a student varies in the rate they gain reading skill over the course of their education; gains are faster in early grades than in later grades. So, the difference in reading skill between typical 1st and 2nd graders is greater than the difference between typical 7th and 8th graders.
A few standardized tests will report a type of developmental scale that is intended to overcome this short-coming, the developmental standard scale. Be forewarned that there is no conventional name for this type of score. Each test publisher may give their own developmental standard scale a name that is unique to their product. It often takes a careful review of a test’s technical manual to determine whether that test offers a developmental standard score at all (many don’t).
Regardless, a developmental standard scale will generally reflect reality better than the grade-equivalent scale. However, the procedures for equalizing intervals are not perfect, and even a developmental standard scale probably should not be considered a true equal-interval scale. Regardless, year-over-year growth in reading will typically not be as large in the upper grades as in the lower grades when using a developmental standard score. But, these scores can be harder to interpret than grade equivalent scores, and their actual scale may vary considerably from test to test. To interpret such scores, the typical developmental standard score for each grade should be used as an anchor point.
Summing up
I’ve written about three kinds of norm-referenced test scores discussed in this blog post: percentile ranks and their kin, standard scores and their relatives, and developmental scales. These different types of scores can be thought of as different scales, similar to the difference between the metric and imperial systems of measurement. In education, different test scales serve different purposes. Some are easier to explain to parents or students or politicians. Others are useful for comparing a student to same-aged peers, and still others are the best choice for tracking students’ progress. Not all are well suited to the kind of numerical manipulations necessary for creating summary statistics, like average scores for a group, or for statistical modeling, like regression models. Now that you’re armed with this information, I hope you will be able to make better choices when using and presenting results from norm-referenced tests.
References
Koretz, D. M. (2008). Measuring Up: What educational testing really tells us. Harvard University Press.