This article is a primer on how to tabulate, organize, and document data for people who don’t have much experience with it.1 I will introduce you to some basic concepts and terms that are common to data work and data organization. Any examples will have an educational tint, but that’s just because I often work with educators. The framework sketched here will apply to most other kinds of data. I’ll assume spreadsheet software is the tool you will likely use for entering and organizing the data, because spreadsheets are widely available and familiar to most people. But, I want to warn you that problems can arise through the use of spreadsheets for data work. I won’t go into a lot of detail about those problems here, and following these guidelines will help to avoid many of them.2 So why Spreadsheets, then? Because they’re easily available and familiar to most people, and that’s reason enough to start with them. What’s more, pretty much everything I say here applies regardless of the type of software you use for organizing your data. My plan is to touch on those issues that come up most often in conversations with clients about their data. But I do want to keep this short, so I can only cover a part of what you might want to know before you begin collecting and documenting data of your own.
Spreadsheets and Tables
Spreadsheets are familiar to most people and so they make a convenient tool for organizing data. Two popular choices of spreadsheet programs are Microsoft Excel and Google Sheets, among others. All have very similar capabilities, and I’m not going to talk about their relative strengths and weaknesses. Either one will get the job done and you should use whichever is most comfortable for you. But this post is not a tutorial on using spreadsheet software for summarization, graphing, analysis, or what-have-you. My focus here is much more basic. I will sketch some best practices for organizing, entering, and documenting your data using spreadsheets. This is so that when the time comes to create summary tables or graphs, it can be done efficiently and confidently. You may be making those summaries in the spreadsheet program itself, or you might be shipping your data off to an analyst who will create summaries for you, perhaps along with other analyses. If you are farming out some aspects of your data work to others, it is especially important that your data be well-organized and well-documented.
Spreadsheets are reasonable tools for organizing data because they make it natural to lay out your data as a rectangle or grid (also known as a table). A data table is simply a contiguous set of columns and a contiguous set of rows on a single page of a spreadsheet file. Many data sets will have more than one table, but you should never put more than one table on a single spreadsheet page/sheet. You may choose to include multiple tables in a single spreadsheet file, but they must be on separate sheets. Or, you may choose to put each table in a separate file. Do not include anything but a table on any sheet that contains a table. In other words, if it doesn’t fit in the table, then don’t put it on the sheet with the table.
Each column in a table represents a field (also known as a variable). Each column should have the name of the field at the top. Every item in a given column is the same type of thing. Every table will include at least a handful of fields, maybe quite a few. More later on thinking through what fields to include. Each row in a table corresponds to a record (also known as a case or observation). A record is just a collection of fields (or variables). Because of the rectangular layout of a table, every record in a given table consists of exactly the same fields, although values of some fields may be missing for some records. Each record in a table will be about one particular person or thing (e.g., a student, a teacher, a school, a district), at one specific point in time. All the records in a table will be about the same kind of person or thing.
For example, you may have a collection of student test scores gathered at a particular point in time (e.g., spring of 2019), or information about the teachers in a particular school at a particular point in time, or information about the schools in a district for a particular school year. One thing to notice is the phrase “at a particular point in time”. Much of the data that we work with is about things that change over time: students, teachers, schools, whatever. It is always important to include collection date as part of any data set. In fact, this should typically be included as part of every observation in a data set. Which fields to include in your data set is an important choice. In general, for each record, you will need to include a unique identifier (ID), a date, and then the other values of interest (test scores and so on). Each of those things will get its own column.
Database software (Microsoft Access is one example) is an alternative to using a spreadsheet to store and organize your data. Database programs are more sophisticated tools for storing tabular data. However, they take more know-how to set up and use than a spreadsheet, and they are less familiar to most people. So, I’m not going to talk about them here, although a lot of what I say will still apply to using databases, especially parts about choosing field names and documentation of datasets via codebooks.
Regardless of whether you use spreadsheet or database software, you should keep in mind that you (your team) will make data entry errors. I’m not going to talk about that here other than to say you should have a method in place for catching and fixing those mistakes. There are several approaches in common use (double entry, read aloud, and visual checking). The gold standard is double-entry. It takes extra time and effort, but is well worth the trouble. Your data are important! You should do everything you can to maximize its accuracy.3
Records (rows) and Variables (columns)
Your data set has two important features. Its structure is the way that it is physically laid out in a file. Its semantics is the meaning of the data. A data set should be laid out as a table (or set of tables). Each table is a collection of records (rows). Each row is a collection of fields (AKA variables), some fields contain quantitative values (numbers) some contain qualitative values (categories or labels), some will contain other kinds of values. Those fields correspond to the columns of your data table. Each variable/column contains a specific kind of data, with a specific meaning and a specific name. For example, all dates are dates, whether a birth date or the date a test is given. They are the same kind of data, but they mean different things. Their names should give an indication of both the type and the meaning of a field (e.g., birth.date, test.date).
Keeping your data tidy means that: 1. Each variable is a single column. 2. Each record is in its own row. 3. Each kind of thing has its own table.
Kinds of Variables
Numbers, categories, and dates are the workhorse data types. The other types listed here are either much less common, or derivative from one of the first three types, or both.
Numeric variables
You guessed it. Numeric variables are those with numbers as values. In general, there are two types: integers and decimals. Integer variables are those that can only be a whole number, at least so far as your data set is concerned. Calendar years, for example, can only be whole numbers. Test scores are typically whole numbers (number of correct answers). Other numeric variables may require more precision and so will include a fractional/decimal component. If a variable does include a decimal component, then it should always be entered with the same precision, the same number of digits to the right of the decimal.
Also, you should be aware of things that seem like numbers, but really aren’t. Numbers are generally the result of counting, or measuring, or an arithmetic operation, like division. But, consider zipcodes. A zipcode (like 06511 for New Haven, CT) is made up of digits, but it is not the result of a count, or a measurement, or an arithmetic operation. It’s really a label, not a number at all, even though it looks like one. If you have a column of zipcodes in your data set and tell your spreadsheet to treat that column as numbers, things can go wrong. For example, leading zeros will be dropped automatically. Then, what you are left with in this example (6511) is no longer a valid zipcode. Similar sorts of problems can arise with ID numbers (e.g., student ID numbers), if they consist entirely of digits.
Another thing to keep in mind is that some types of standardized test scores are not actually numeric, even though they may appear to be at first glance. Age- and grade-equivalent scores are typically reported as numbers, at least within the body of their range. Although, at the upper or lower ends of these scales, the tabled values may be an inequality, or other not-strictly-numeric value. For example, the maximum grade-equivalent score on the Nelson-Denny Reading Test is “16+”. The “+” is a cue that we are not dealing with actual numbers. In technical terms, age- and grade-equivalent scores are not on a ratio or interval scale of measurement, and so they should not be added, subtracted, or averaged. Properly speaking, age- and grade-equivalent scores are just labels for ordered categories.
Category variables
You will often hear this type of variable referred to as a factor. Don’t be put off by the unfamiliar terminology. A category variable is just a data type consisting of a set (often a smallish set) of named values. There might be a natural order to the values, like the names of months (or grade-equivalent test scores!), or there might not, like the suits in a deck of playing cards (or zipcodes). My strong preference is to use only lower-case letters when writing the names of categories, for essentially the same reasons that I use all lower case for the names of variables. For example, write (jan, feb, mar, apr, etc), not (Jan, Feb, Mar, Apr, …). The important thing is to BE CONSISTENT. If your intention is to use ‘jan’ for January, then use it always; never use ‘Jan’ or ‘january’ or ‘January’.
While category variables often have a small number of values, there are exceptions. Individual identification codes are one example. A school district might easily have distinct student IDs for thousands of students.
Date variables
Dates are a surprisingly complicated type of data. An important thing to remember when working with dates is that you should be absolutely consistent in the format you use for entering them into your spreadsheet. Choose a format that is unambiguous and clear and then always use that format and no other. Sadly, Excel often makes a mess of dates (it’s trying to be helpful but, you know…). One way to avoid that is to tell your spreadsheet to format date columns as “text” when you first set up your table (after you put your column names in the first row, before you enter any data!). In Excel, you can do this by right clicking the letter at the top of a date column, select “format cells” from the drop-down menu, and select “text”. The process is similar in other spreadsheet programs. Regardless, I recommend that when entering dates, you use a format like jan 25, 2001. Avoid representing the month as a number. In my experience, formats like 01/25/2001 are more likely to lead to entry errors. In many cases you may only need to include a year, or a month and year, in your data.
Binary variables
A binary variable is one which can have one of two values. It is really a special case of category variable. It might appear to be numeric, in which case the values will typically be 1 and 0 (but not always). It might be a more obvious category variable with values like yes and no or true and false, or even female and male. In past times, it was not unusual for binary category variables, “female” and “male” for example, to be entered into a data file as numbers. For example, a 1 might correspond to “female” and a 0 to “male”. There were good reasons to do this, when analysis programs were simpler and less powerful, but these days it’s not necessary. What’s more, using numbers for category labels can lead to errors. Data entry errors can arise because translation from a verbal label to numerical label makes it more difficult for whomever is doing data entry to keep things straight. But errors can also arise when interpreting numerical labels in an existing data set because the numbers generally don’t have an intuitive correspondence to their meaning. Use meaningful labels for categories.
Text variables
A text variable is the result you might get in response to an open-ended question or other prompt on a questionnaire. The actual text in a text variable will rarely be exactly the same from one instance to another. Because text variables are typically the result of an individual’s choices about how to express themselves on a particular topic, you should accept whatever they give you. Make no changes or “corrections” at all. A text variable can range from a few words, to a short paragraph, to a much longer bit of text. In the case of online questionnaires, there will often be a word limit (or character limit) to the response. If so, then that limit should be noted in your codebook entry for the relevant text variable.
Text variables are more complicated to analyze than the preceding types and you may not often see them, but you should be aware that they exist and need to be handled differently from “category” type variables.
Other kinds of variables
Addresses, names, and such are closer to “text” type variables than anything else. I would not apply a “lower-case rule”, as for category variables, for names of people, streets, towns, and so on, because capitalization might be considered a natural part of the name of a person or thing. It is often appropriate to break down these types of information into separate fields. Names might be entered as first.name and last.name; addresses would typically be broken down into at least street.address, city, state, and zipcode.
Field or Variable Names
Naming the fields (AKA variables) in a data set well is a critically important first step toward documenting your data. But make no mistake, field names alone are not sufficient documentation. I’ll sketch out some simple rules for creating reasonable field/variable/column names. However, the first principle is that field names should be clear and unambiguous. Keep in mind that the name of each field stands in relationship to the kind of information it contains, but also in relationship to other field names in the data set.
Field names should contain only letters (unaccented letters of the roman alphabet), digits, and the characters “_” or “.”. The characters “.” and “_” are the only acceptable characters that are not letters or digits. With regard to letters, my strong preference is to stick to lower case letters. This is really just for the purpose of keeping things as simple as possible. If you use mixed case you end up in the position of having to decide when to use upper vs lower case, and then remembering your choice for a particular variable name when you (or your analyst) go to retype it later on. Just trust me on this one; stick to lower case.
Field names must begin with a letter.
Choose either “.” OR “_” to use as a separator in variable names (
age.months,dibels.lnf), but stick to one or the other; don’t use both. If you use “.” as a separator in some variable names, then use it for all that require a separator. My preference is for “.” just because I find it easier to type than “_”.Use meaningful field names. Strive for clarity in choosing field names. Avoid ambiguity as much as possible. For example, prefer
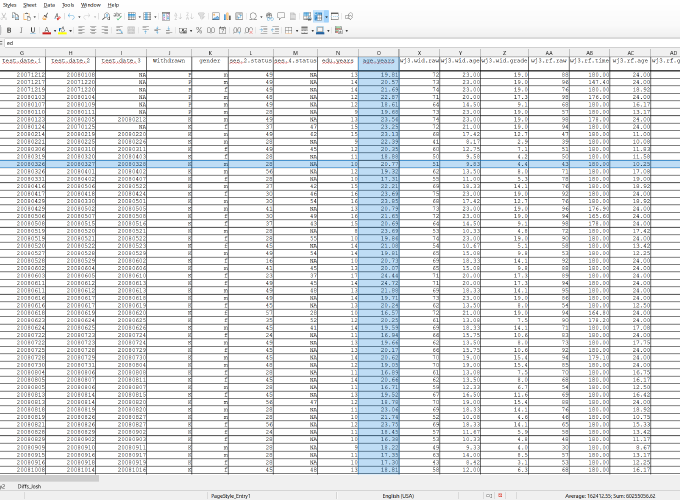
birth.dateoverdob,student.idoverid.Education oriented folks will often have student test scores of various sorts in their data sets. Consider a case where you are collecting Woodcock-Johnson Tests of Achievement scores for students. The standard form of this test battery (version IV) includes 9 different subscales, including reading comprehension, reading fluency, math problem solving, and others. Scores for each subscale are available as standard scores, percentile ranks, age-equivalent scores, grade-equivalent scores, and relative proficiency index. There are also 3 parallel forms of the test battery. That’s a lot of information: a) name of test battery, b) version, c) form, d) subscale, e) score type. You want to include all of it in your data set. It is very helpful to organize field names for related bits of information systematically. My usual approach is to use a set of fields. You’ll want to capture each score type for each subscale in its own field should also include, at least, the name of the test battery. So, the field for Woodcock-Johnson (wj) reading comprehension (rcomp) standard scores (std) might be named
wj.rcomp.std. Other types of scores for the same subscale (rcomp) could bewj.rcomp.pr,wj.rcomp.ae,wj.rcomp.ge,wj.rcomp.rpi. Using this scheme, what might you name the fields for reading fluency scores? For math problem solving?If you only will ever use one version and one form of a test batter, then it is not unreasonable to bundle that information into the column name as well (e.g.,
wj4a.rcomp.pr,wj4a.rcomp.ae,wj4a.rcomp.ge,wj4a.rcomp.rpi). I think a better way of including these details is to carefully document test version and form in your Codebook. See below. BUT, if your data include (or may include in the future) scores from other versions or alternate forms of a test batter, you will definitely want to include that information in separate fields (e.g.,wj.version,wj.form), so that it’s available for analysis.At least some binary/boolean/two-valued variables can be usefully named as predicates:
is.sped,is.ell. You might think of these as questions: “Is this student an English language learner (ELL)? The category labels within each column can then beyesandno.For a numeric field, its name should include an indication of its units:
age.months(age in months),age.years(age in years),ppvt.std(PPVT standard score).
You’ll notice the use of abbreviations in some of the example names above (sped for “special education”, iep for “individual education plan”, std for “standard score”). That’s fine, but don’t overdo it. Variable names should be short, but not so short that they are hard to interpret. Ideally, variable names should be meaningful enough and memorable enough so that someone looking at your data set would have pretty good idea of what a given variable consists of, without having to go to the codebook.
If your data set consists of more than one table, then it is inevitable that some variables will occur in more than one table. It is very important that you use exactly the same name for a given variable, in every table that includes it. Also, once you have been using a set of variable names within a given data set, it’s best never to change them, even if you decide that they are not ideal.
What Fields Should You Include?
There is no one right answer to this question. If you are collecting your own data, there may be many potential variables available to you. Which ones you include in your data set will depend on a number of considerations. On the other hand, you may be using data that comes from somewhere else (e.g., a school district, a state department of education). Consider two situations. In the first, you start with questions, a purpose, a set of goals, but no data. Your job is to collect data that will let you satisfy your goals. In the second case, you have, or have access to, data that has already been collected for some purpose, maybe by you, maybe someone else, and now you want to re-use or recycle that data for some other purpose. Your first step is to evaluate the “found” data to see if it can be re-purposed to satisfy your present needs.
In the first instance, you choose what data to collect in order to serve your purpose. In that case, for each potential variable you’ll want to consider (1) its value in contributing to the answers you want to extract from your data, and (2) and the cost of including those particular variables. It’s a very good idea to consult with an expert before you collect any data to make sure that the questions you want to address and the data you intend to collect are well-aligned. You really don’t want to get this wrong. Data collection can be an expensive and labor-intensive process. It can be truly disheartening to spend time and money collecting data only to discover it won’t serve to answer the questions you need answered.
In the second case, where you’re using “found” data, you don’t really get to choose what to include since you’re relying on data that has already been collected. Still, you want to be able to evaluate that data in order to decide if it can be used to answer your questions.
So, here are some of the fields you want to have in a data set, whether you’re collecting the data from scratch, or evaluating found data to see whether it might serve your purposes. The first two are absolutely critical, must haves.
Unique and persistent IDs: Every individual, whether it be a person, a school, a district or whatever, should have an identifier (ID) that is unique to that individual and that never changes. You may borrow these IDs from another source (e.g., student IDs assigned by a school district; school or district IDs assigned by an LEA), or you may create them yourself, but they absolutely must be unique in the context of your data set. If you borrow them from somewhere else, your codebook should say where. If you create them yourself, your codebook should state the rule you used to create them.
Date: When were the data collected? This might be an exact date, or it might be a month and year, or even just a year. How fine-grained your date information needs to be will depend on what you want to do with it. Regardless, time must be in a field in your data set. In other words, you must have a column labeled “date” or “year” with an appropriate value for every record. Sometimes, you may come across a data set where time is in the file names (
test_scores_2017.xlsx,test_scores_2018.xlsx), or part of a column name (dibels.composite.2017,dibels.composite.2018), but there is no actual field such that each record is associated with a date. This is not ideal, but the situation can usually be salvaged by adding an appropriate field to the data set and filling it with date info taken from the file name or column name. Just to be clear, it’s fine to include date information in file names. If you have 5 files, each with test scores from a different school year, you want to be able to tell what each file contains at a glance, but it’s not enough. You also need that information in the file itself. Each of those files should include a field/column that lists when those scores were collected.Test Scores: Student test scores will be the central interest for many readers of this blog. Standardized test scores make use of a variety of different scales: standard scores, age equivalent scores, grade-equivalent scores, stanines, percentile ranks, and others. Each of these has its own uses and it is critically important to include the scales that are aligned to your needs. Whenever possible, you should also include the raw test scores that are the bases of the scaled scores in your data set.
Survey Responses: You may have data in the form of responses to a survey or questionnaire. These days, survey data is most often collected with an online tool like Qualtrics or SurveyMonkey. As such, you will not have much control over the format of the data file these tools provide, but they typically provide reasonable options. Both SurveyMonkey and Qualtrics can export data as either Excel files or CSV files, among other options. A CSV (comma separated variable) file is a commonly used method of storing tabular data. In general, CSV files will be your best option for export; they are easily viewed in any spreadsheet program and are generally more portable than a native spreadsheet file format. Qualtrics and SurveyMonkey, and most similar tools, give you some control over variable names and when you set up your survey (before you collect data!), you should name your variables carefully according to the guidelines I’ve given in the previous section.
Demographic info: For individuals, this might include things like: race, ethnicity, ELL status, gender, family income, attendance, age, grade, and others. Many of those variables will be category variables at the level of the individual (e.g., race/ethnicity, ELL status). Demographics for schools or districts, might include the average values of those same statistics, taking into account all enrolled students. Often, individual level category variables become numeric when averaged over a school or district (e.g, percent white, percent black, percent ELL).
For students, you might also include things like special education status (is.sped; yes/no), individualized education program designation (iep; 1 of 13 categories defined by IDEA).
There will certainly be other information that is specific to the questions you want to address with your data. It is better to include too much than too little in your data set. It is not always possible to predict in advance what may be useful. But, it is always worth thinking carefully about what variables to include.
Missing Values
The value of any type of variable might be absent, for one reason or another. When that happens, one option is to simply leave that cell of the spreadsheet empty. In fact, that is the only choice that works if you are going to summarize your data inside the spreadsheet itself. My preference is to use an explicit code for missing values. A couple of commonly used choices are “NA” and “.” (leave off the quotation marks). In other instances, you may find a data set that uses a specific numeric value to represent missingness. This might be a negative number or a value like 999, that can’t occur naturally as part of the data. Using numeric values to represent missingness is an especially bad idea. DO NOT USE A NUMBER TO REPRESENT MISSING VALUES.
Codebooks
A codebook, or data dictionary, is a separate file from your data set that describes the layout and contents the data set. Ideally, your codebook should be a plain text file.4 This is to make your codebook as easily accessible as possible, at the time you write it and far into the future.
Your codebook may (should) include a preface that gives details of who collected the data, for what purpose, and how it was collected. An important part of that overview will be information about who or what the data is about.
The next part of the preface is technical information about the data files themselves. How many files are there? What program was used to create them (and what version)? How are the files named? How many tables are in each file? How many rows and columns are in each table?
Finally, a codebook includes a complete and self-explanatory description of each field/variable/column in the data set. Generally speaking, a variable corresponds to a single column in a table. The order of descriptions in the codebook should match the order of columns in the table. If your data set consists of more than one table, then your codebook should have a separate section for each table. Each entry will include at least:
Variable name: This is the column heading in the data set.
Variable type: numeric, categorical, binary, and so on.
Possible values: This is especially important for category variables. For category variables with relatively few levels, list all of the levels and give at least a sentence of explanation about what each label means. If the categories are responses to a multiple-choice type question, like might be found in a survey, then list the full question and all possible responses.
For numeric variables, list the range of possible values. Often these are restricted to a certain range. Percentile ranks are an example. Similarly, make clear whether numeric values are integers or decimal values. For the latter, specify the number of significant digits.
Notes: For test scores or questionnaires from published material, you should give a full citation to the source. You can see what an adequate citation looks like below. Also, be sure to include version number and form of the instrument, as appropriate (e.g., PPVT, version 4, form B). If a variable corresponds to a derived score (standard score, age equivalent, stanine, etc) from a published instrument, then the notes field for that variable is the right place to say so.
Dunn, L. M., & Dunn, L., M. (2007). Peabody Picture Vocabulary Test (4th ed.). Minneapolis, MN: NCS Pearson Inc.
Good, R. H., Kaminski, R., Dewey, E. N., Wallin, J., Powell-Smith, K. A., & Latimer, R. J. (2013). Dynamic Indicators of Basic Early Literacy Skills (DIBELS) Next Technical Manual. Eugene, OR: Dynamic Measurement Group.
Summing Up
I hope I’ve given you enough of a grounding in data organization to avoid some common pitfalls in laying out a data set for the first time. Building a vocabulary and framework for thinking about tables, and records, and fields, and variables and how these relate to the sheets and columns and rows of a spreadsheet are an important first step in the direction of building a data set that will allow you to use it for making summary tables or graphs, or more sophisticated analyses that can speak to the questions you want to answer. Spreadsheets are a reasonable, albeit imperfect, tool for organizing small to medium sized data sets. With care, you can do a lot with a spreadsheet, but keep in mind that there are other tools out there, even if the learning curve might be a bit steep in the beginning. If you are new to data work, you might want to seek advice from a more experienced hand before diving too deeply into a mission-critical project.
- While writing this blog post, I came across a paper by Karl Broman and Kara Woo that covers many of these same issues. It is pitched more toward data scientists and other professional analysts, but if you are hungry for more after reading this blog, then it may be worth your time. [BACK]
- Here’s a link to an interview with data scientist and developer Jenny Bryan, where she goes into some depth on the problems with spreadsheets from the analyst’s perspective. It’s very much “inside baseball”, but you may want to take a look if you are interested in a deeper dive into some of these issues. [BACK]
- Learn more about data-checking and double entry here: Barchard, K. A., & Verenikina, Y. (2013). Improving data accuracy: Selecting the best data checking technique. Computers in Human Behavior, 29(5), 1917–1922. https://doi.org/10.1016/j.chb.2013.02.021 [BACK]
- I like the idea of using a markdown format for a codebook. It is a plain text format that also allows for easy conversion from plain text to well-formatted pdf or docx or html (and many other formats). But, if that seems like a bridge too far for you just now, given all the other new things you’re trying to get a handle on, then put it off for another day. Use whatever program is most convenient for you to create your codebook (MS Word? Google Docs?). [BACK]